By Emily McGinn & Caleb Crumley
Digital Humanities Lab, University of Georgia, Athens
Undergraduate and graduate students at Davidson, Duquesne, and the University of Georgia researched and wrote biographies of figures in avant-garde circles in New York, Florence, and Paris connected to Loy. Students entered metadata about these figures into a spreadsheet, which Emily McGinn and Caleb Crumley at UGA’s Digital Humanities Lab used to generate a visualization of Loy’s social and artistic network in Florence, New York, and Paris (read our blogpost about this collaboration).
[Click on map to enlarge]
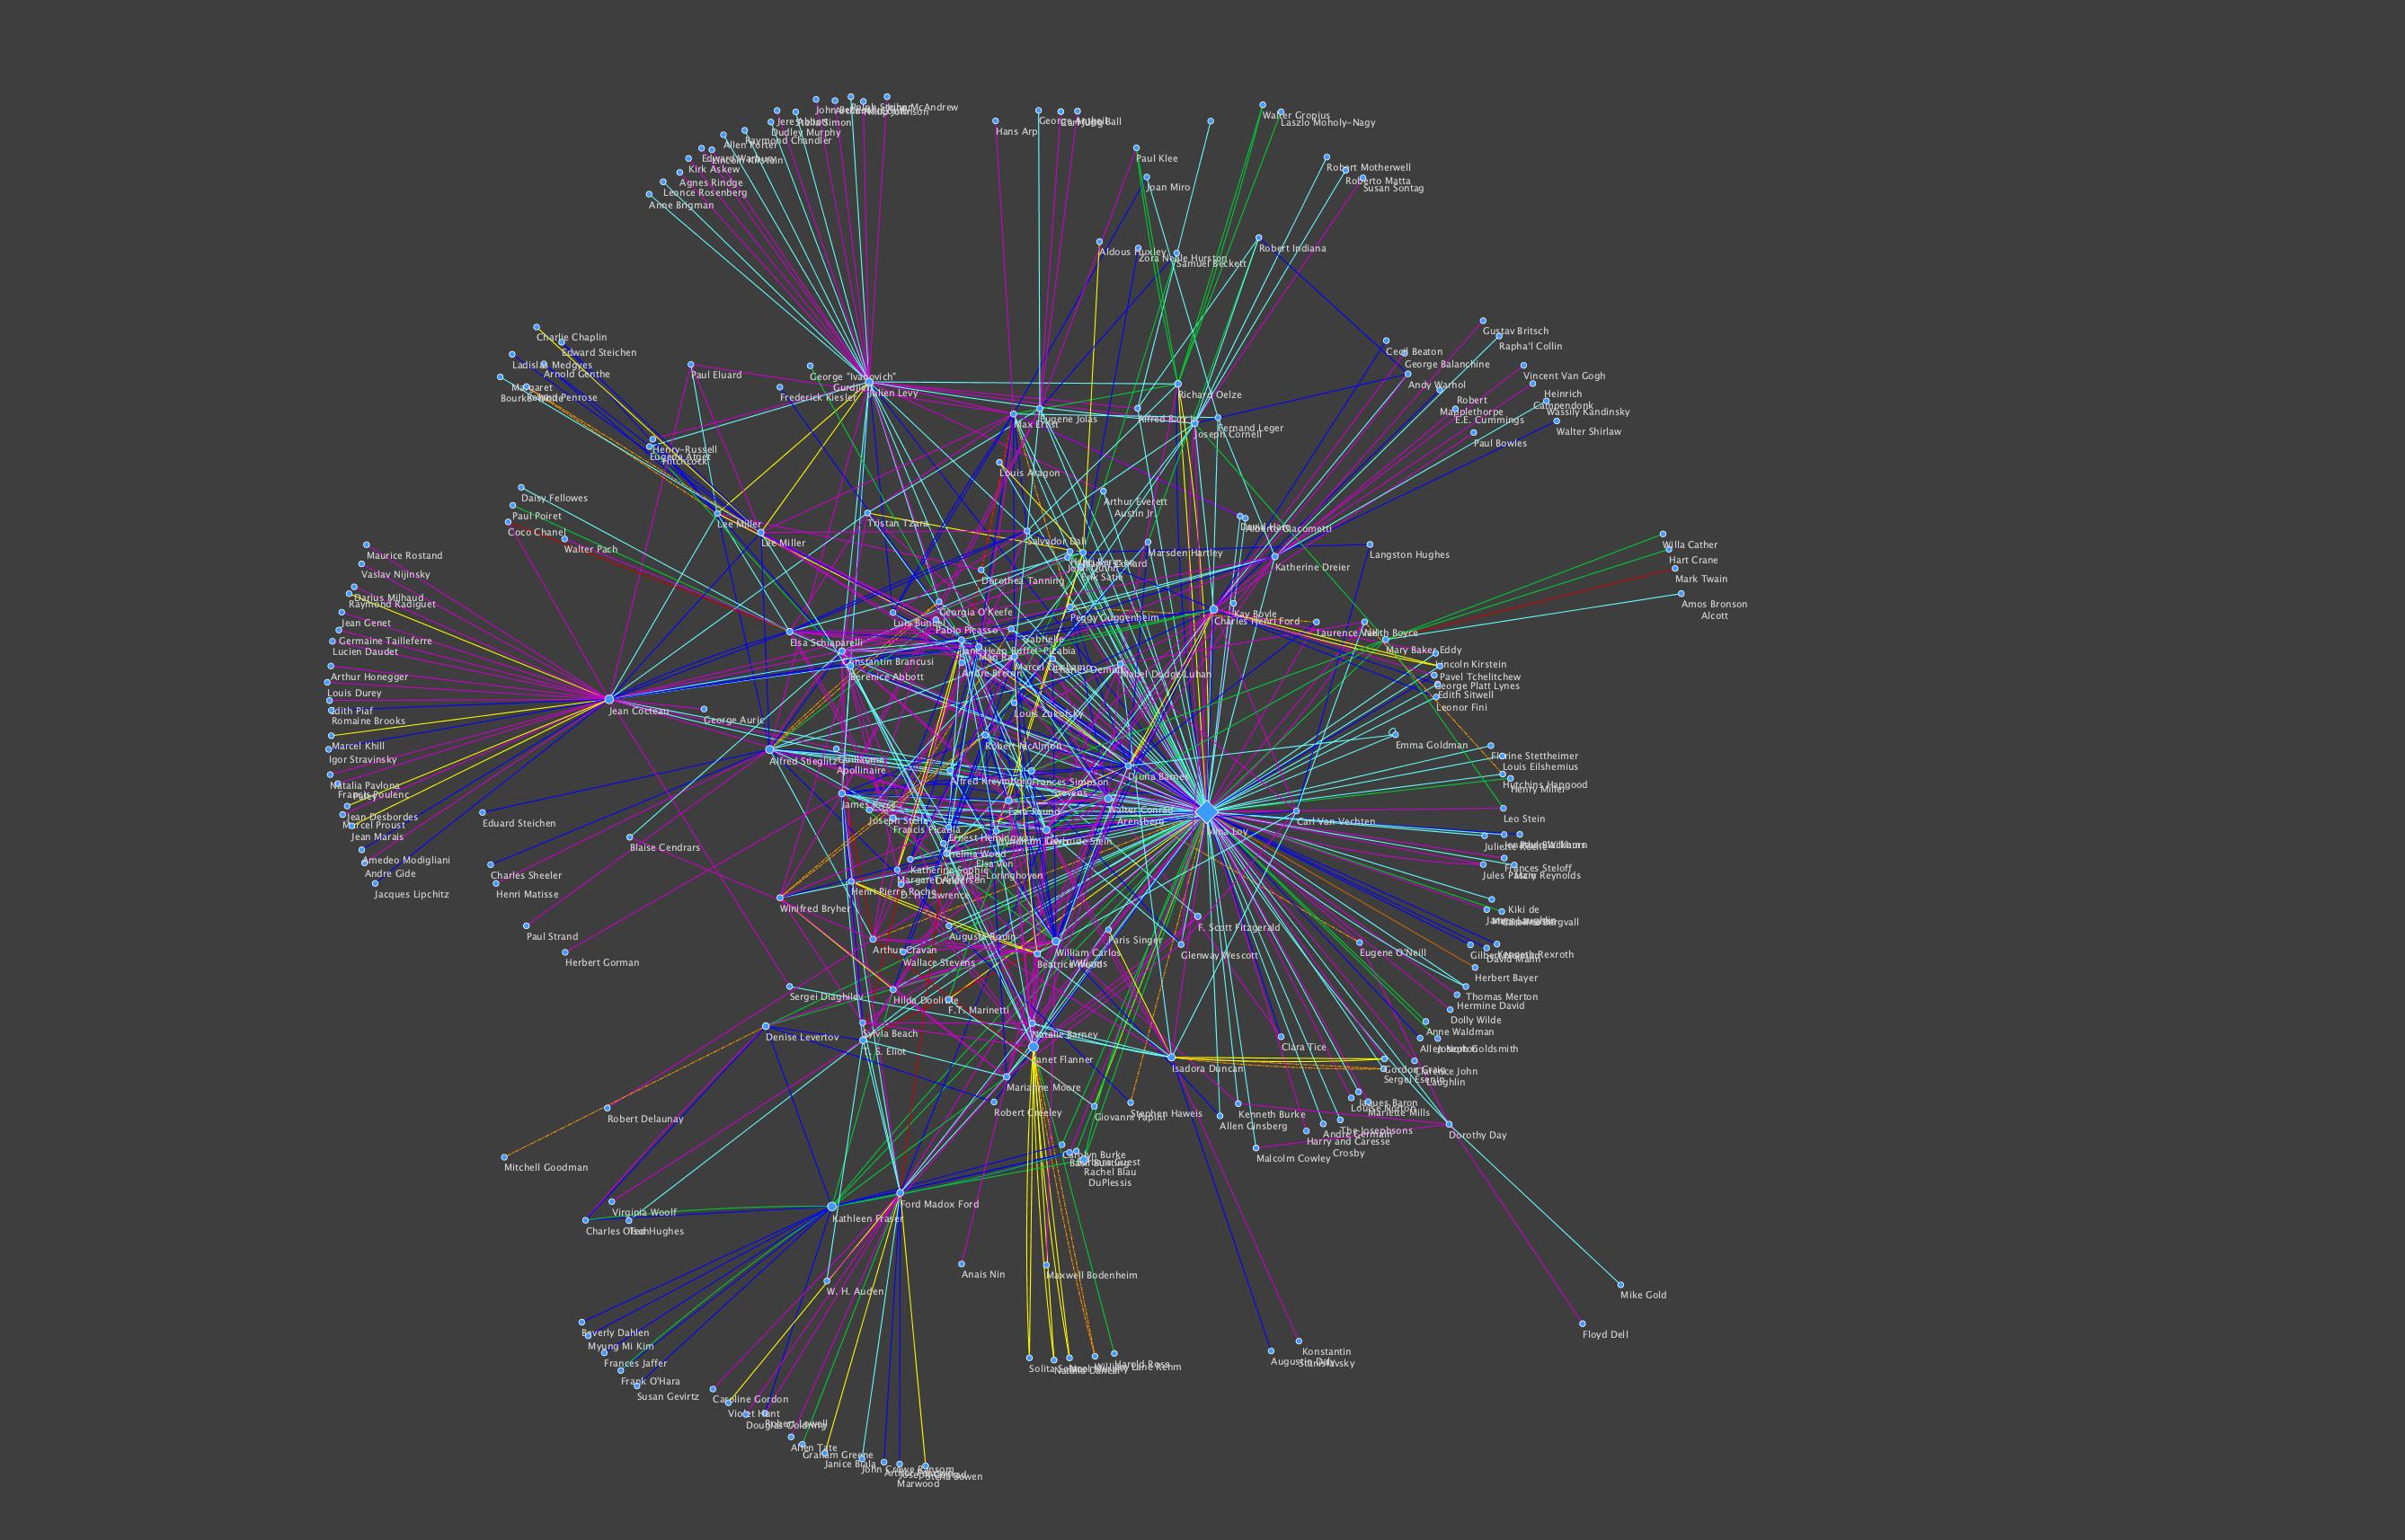
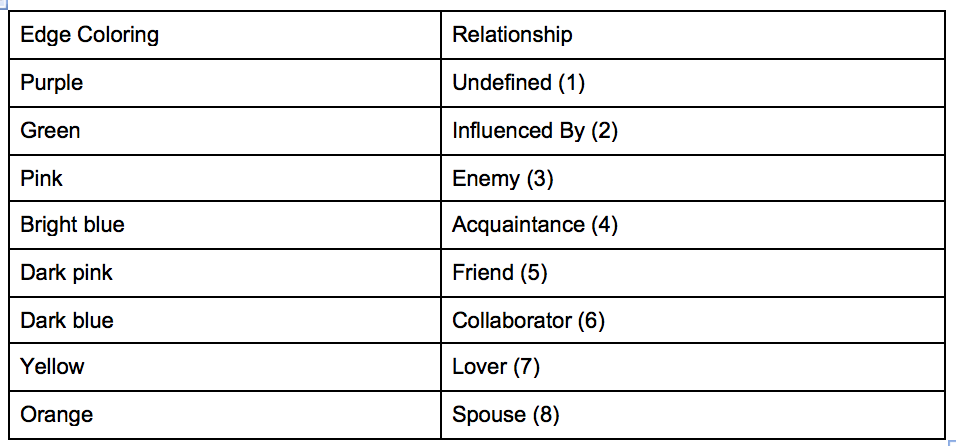
This network is a visualization of Mina Loy and the connections she made with other writers and artists, both personally and through her work. Each node (circle) represents a person connected to Loy. Each edge (line) between the nodes is colored according to the type of connection the person had with Loy (see legend).
You may notice that some nodes are sized differently than others. Their size is based on their betweenness centrality, which means that a node with a greater betweenness centrality is a node that serves as an essential connection between other parts of the graph. Without this connection the graph would be disjointed and disconnected. The bigger the node, the more clusters the node connects.
Mina Loy is the largest node since she connects the majority of other clusters. Her connections make her central to the graph as a whole. If we were to remove her from this network, there would be a number of disconnected clusters. Therefore, the size of Mina Loy’s node does not not directly correlate with the number of edges, but rather the number of clusters that she connects. If a node with only one edge, a leaf node, were to be removed, it would have little to no effect on the layout since it does not connect any clusters together. You can read a more detailed explanation of network graphs at UGA’s DigiLab.